Links
Climate change
EV
Genealogy
Linux

This page shows some charts prepared by Robbie Andrew of CICERO, taken from this page.
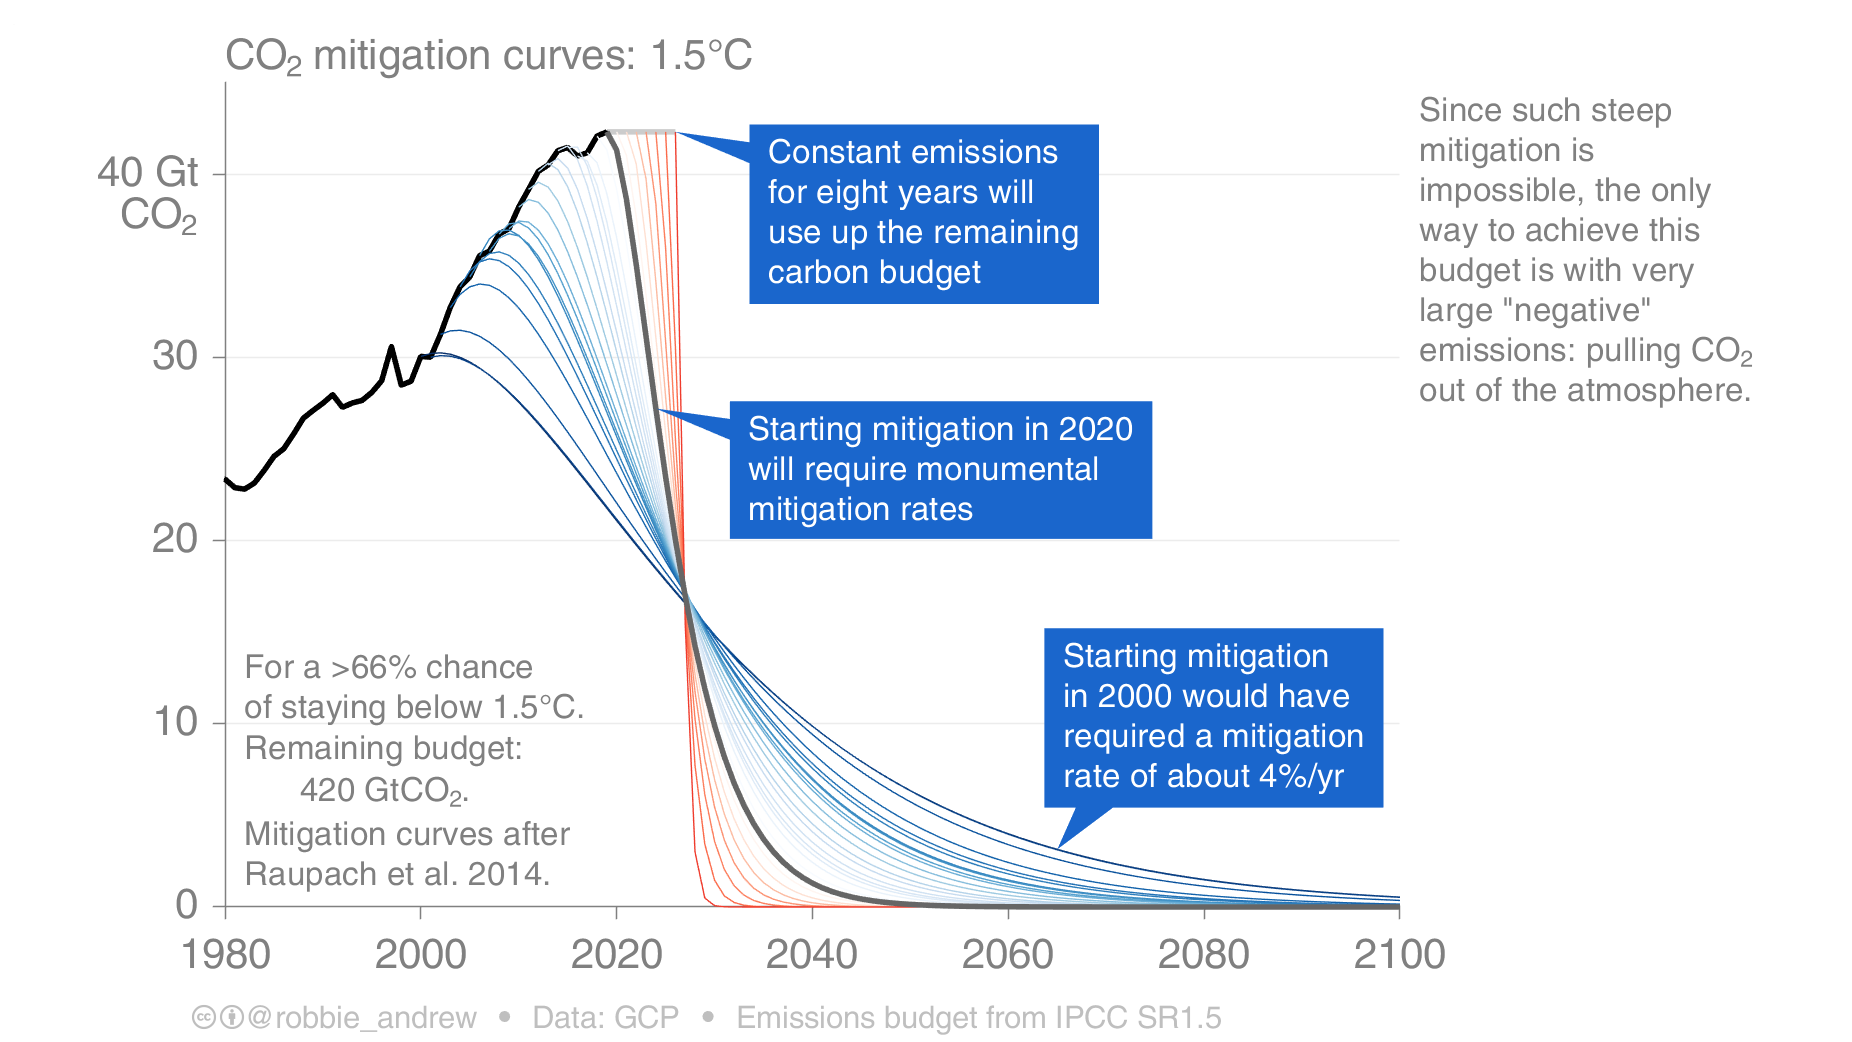
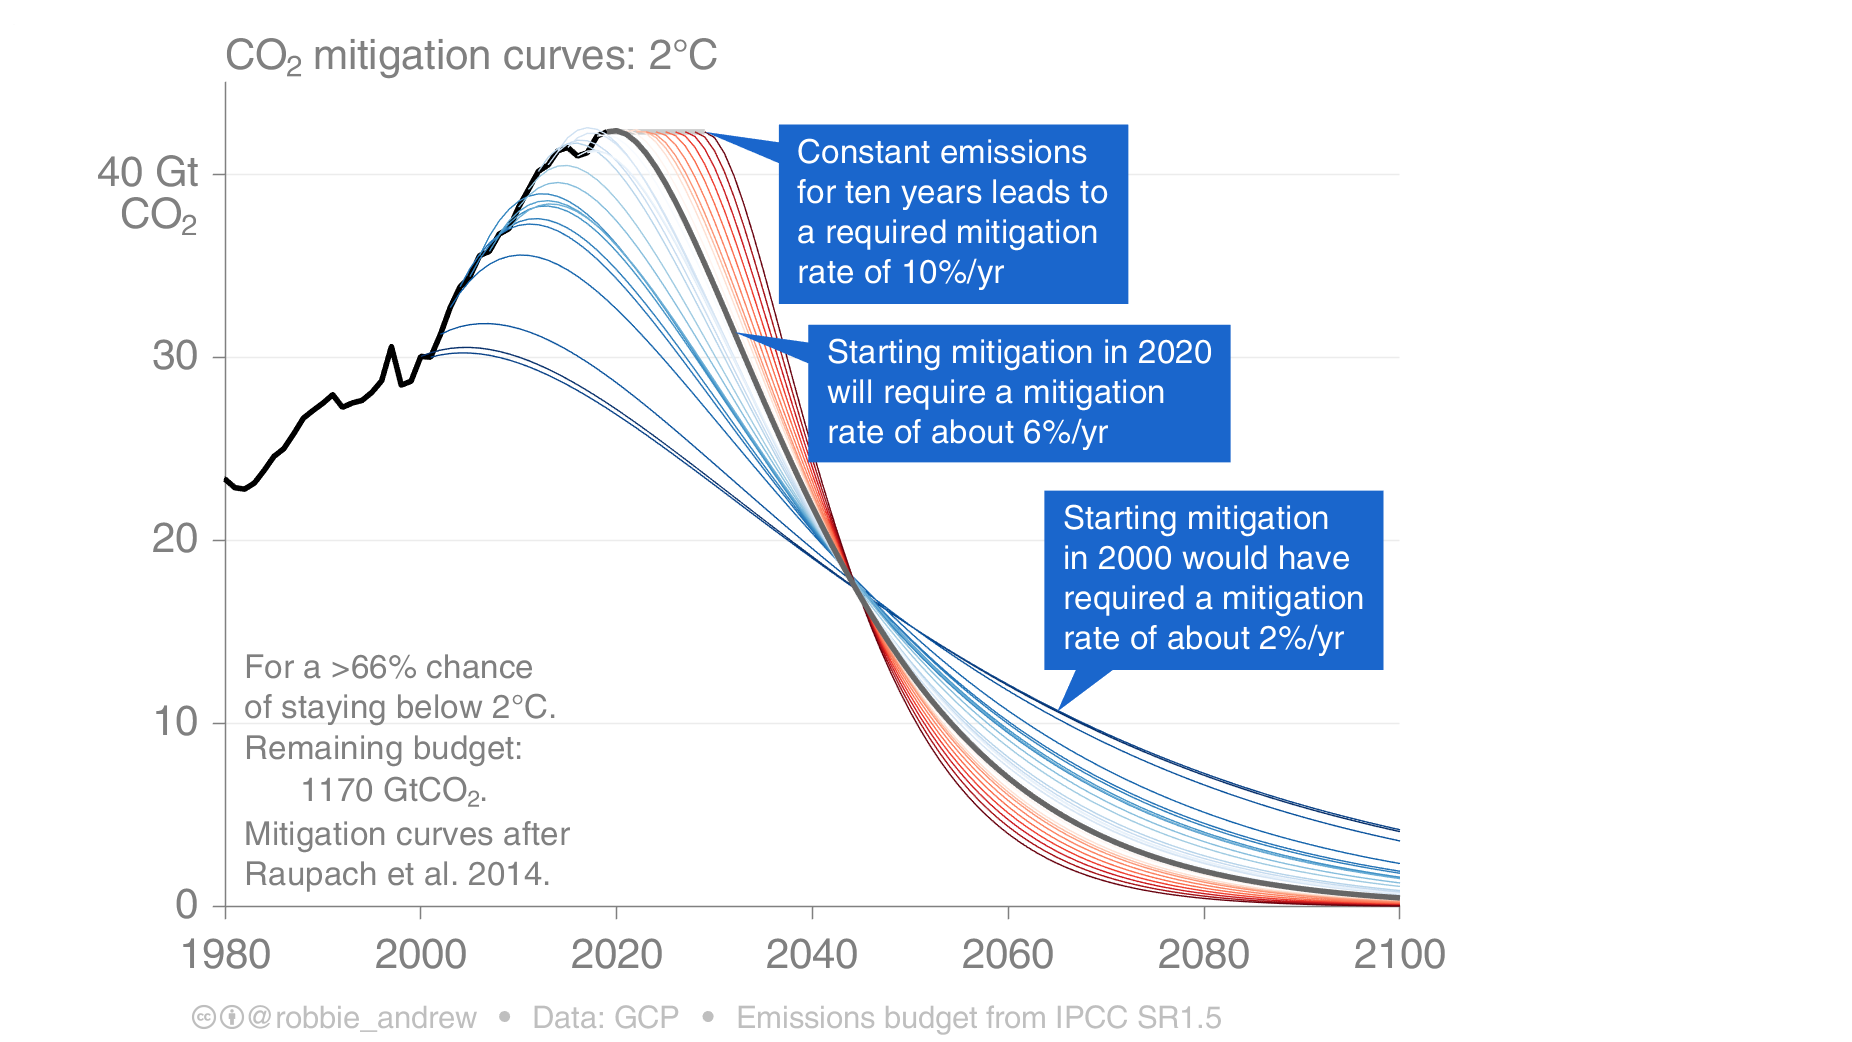
Overall, these charts show that limiting the global temperature increase to 1.5°C is no longer feasible. Even limiting it to 2.0°C requires a massive urgent reduction in greenhouse gas emissions. These charts are from 2020, so the situation is even worse now because there hasn't been any meaningful reduction in emissions since then.
Updated 6 June 2022
© Peter Hewett GPL